Templates / Finance
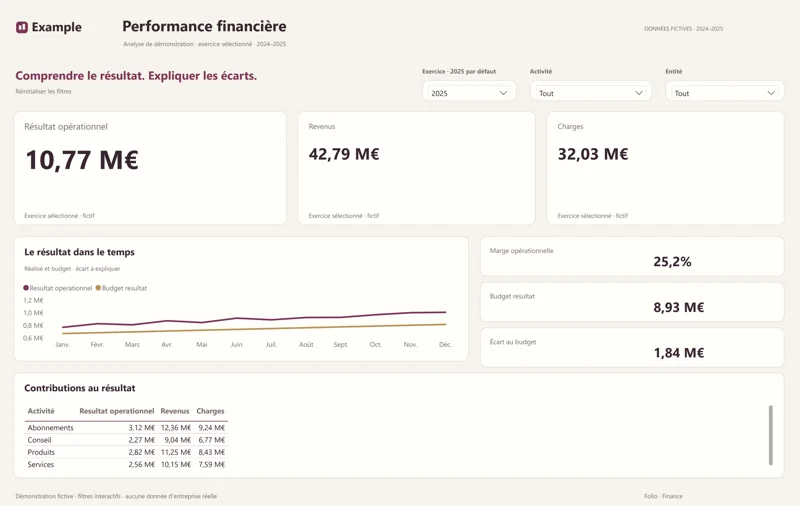
Bridge: finance report template for Power BI
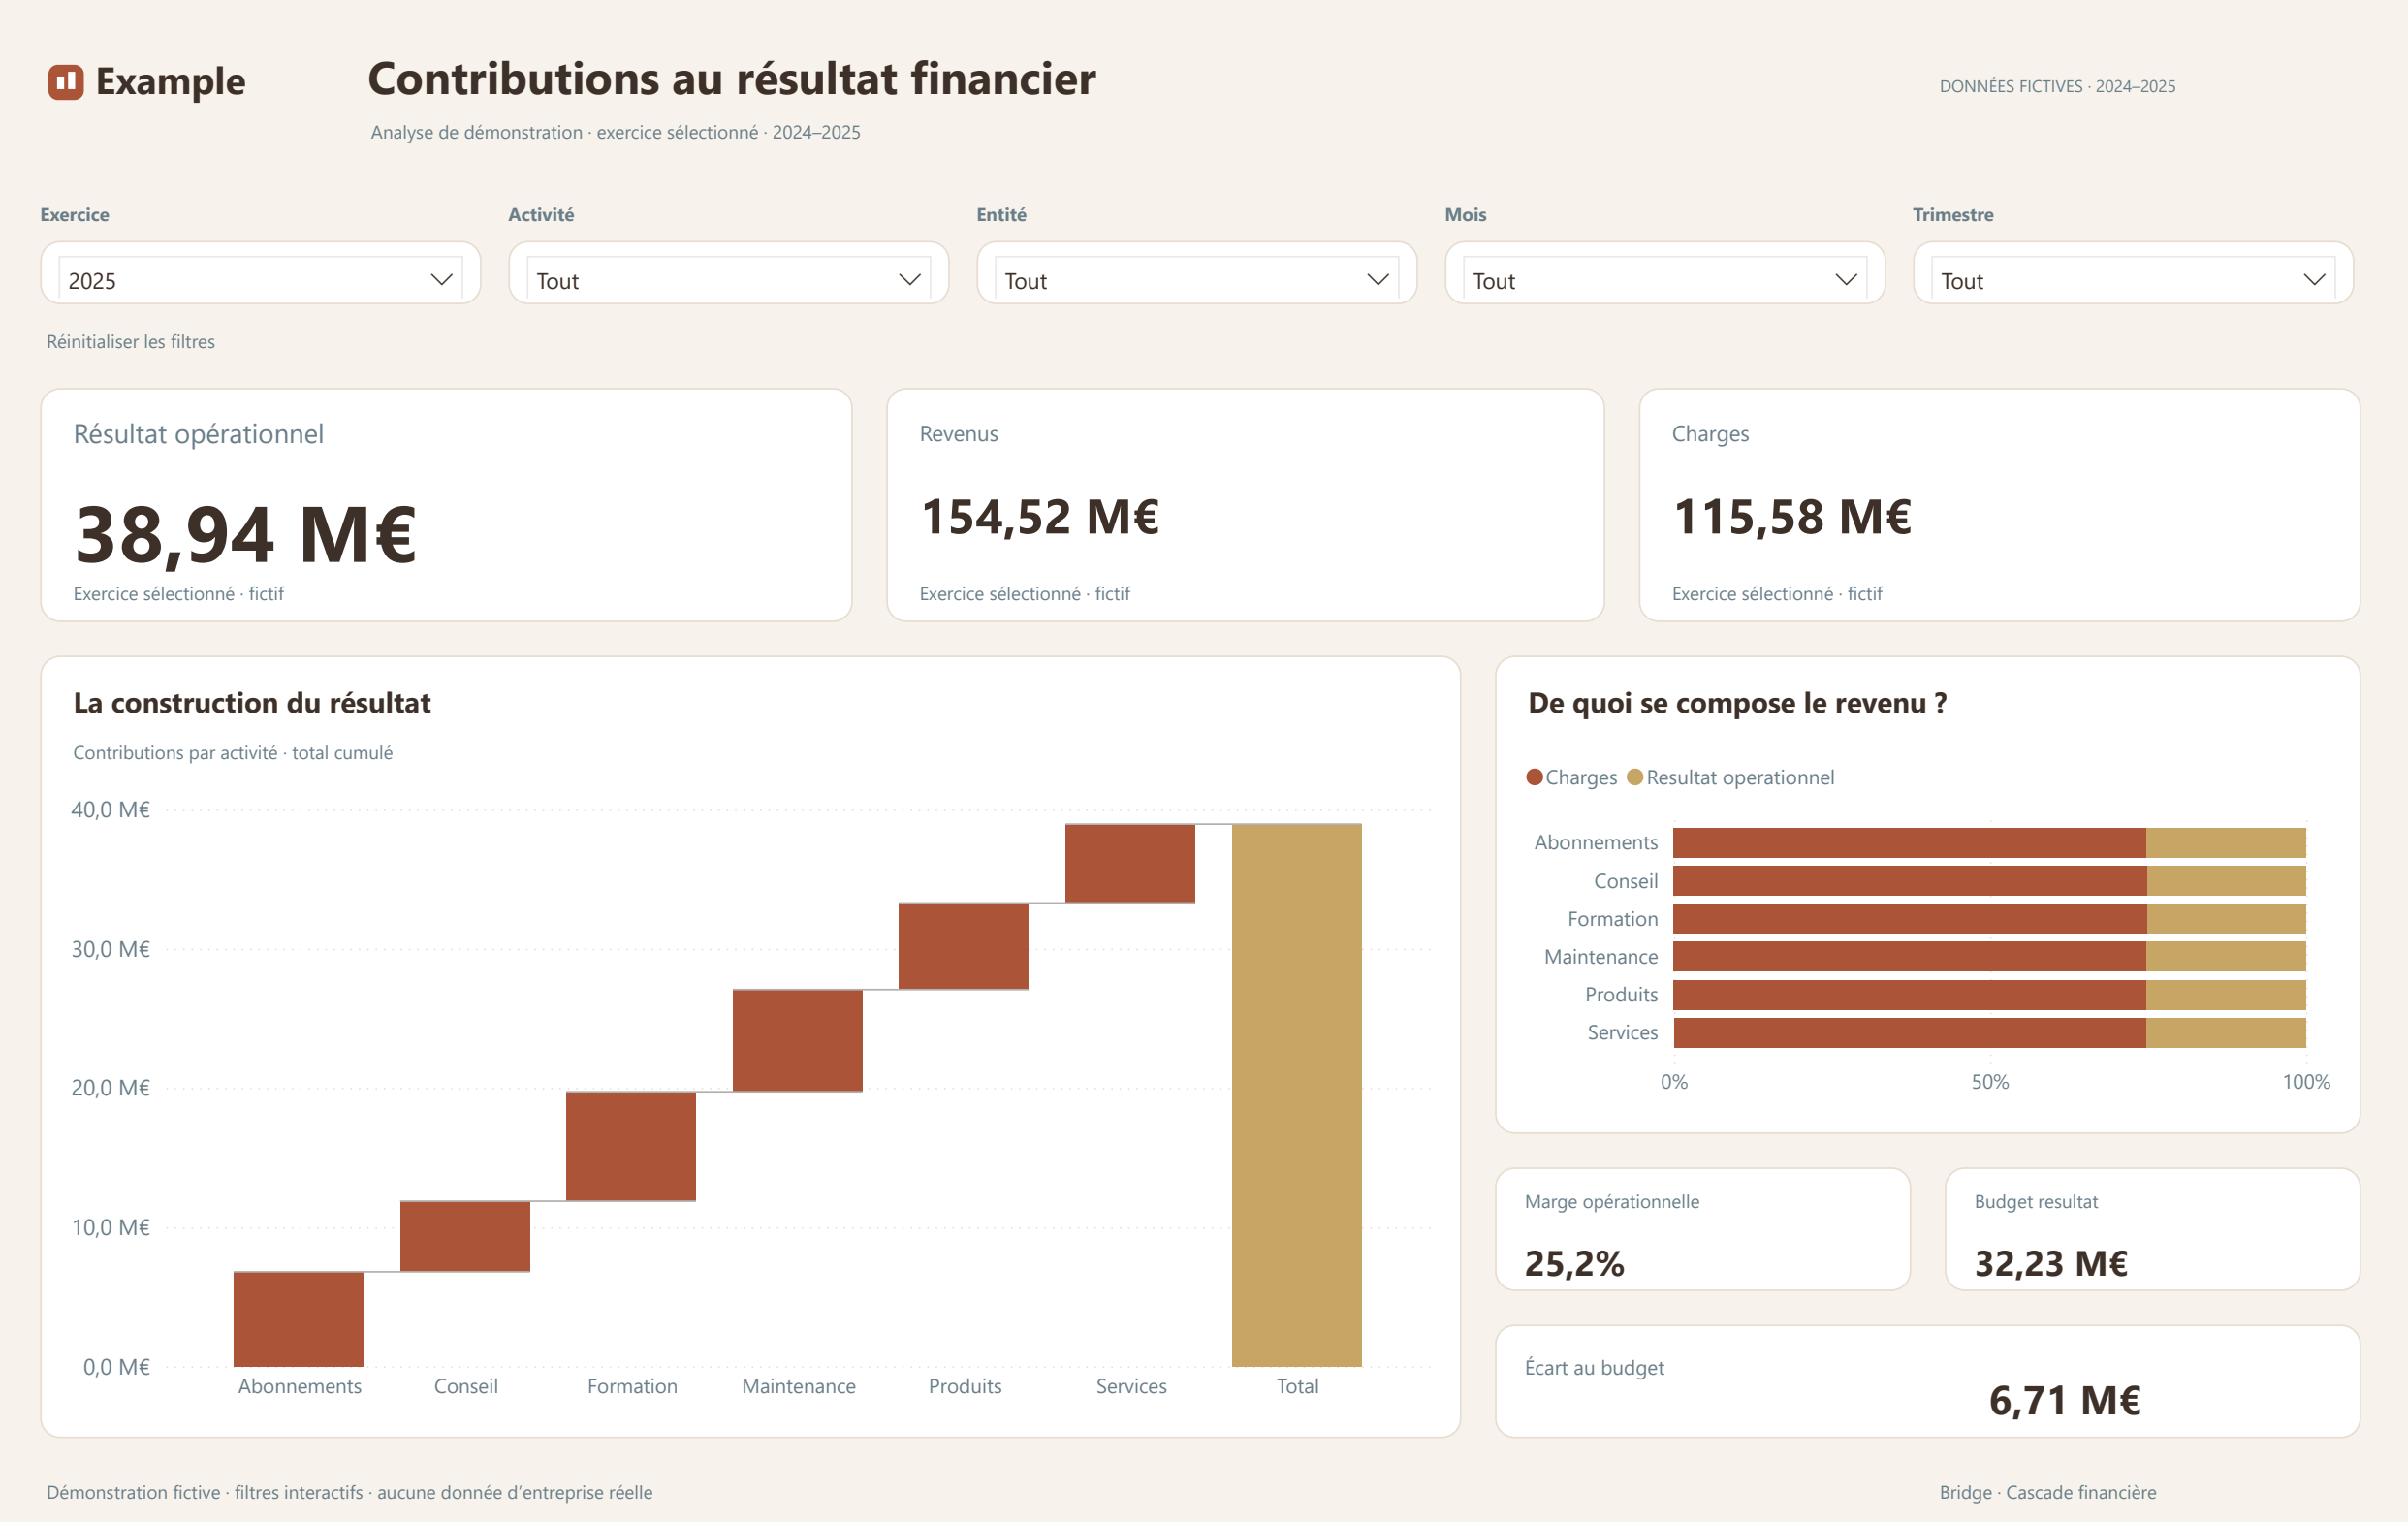
An operating-profit contribution waterfall, revenue structure and five filters.
What it shows
Explain operating profit against budget, cost structure and the contribution of each activity and entity.
Typical KPIs
- Operating profit
- Budget vs actual
- Costs
- Contribution
What you get
- Native, editable Power BI visuals (PBIX)
- Light theme, five top filters
- Fictitious demo data, PDF export
- Demo report labels currently in French
- Pages and KPIs adapted to your brief
How to start
Open the studio, describe the business need (goal, audience, pages, KPIs), choose Bridge and generate a first demonstration report once signed in. Connect your own data model afterwards.