Templates
Power BI report templates
16 native, editable report designs for sales, logistics, production, finance and people. Pick one, describe your business brief, and dashport builds your first Power BI report with demo data.
Sales
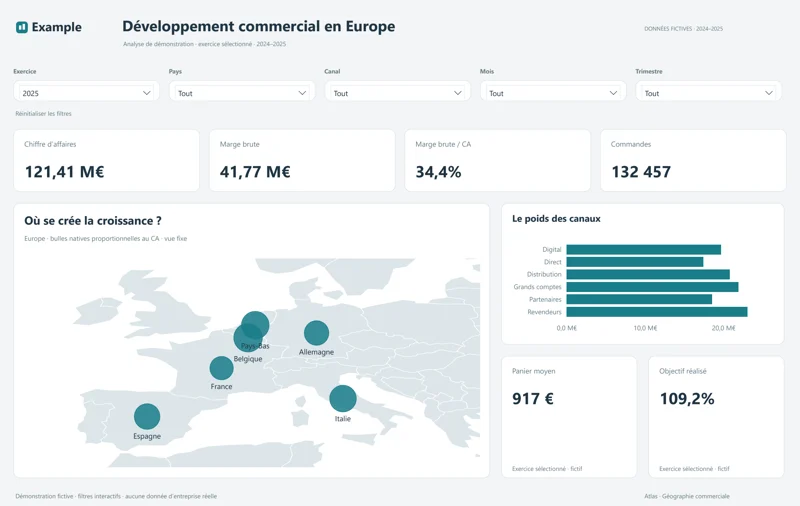
Atlas
A fixed Europe map with native bubbles, six countries, six channels and five top filters.
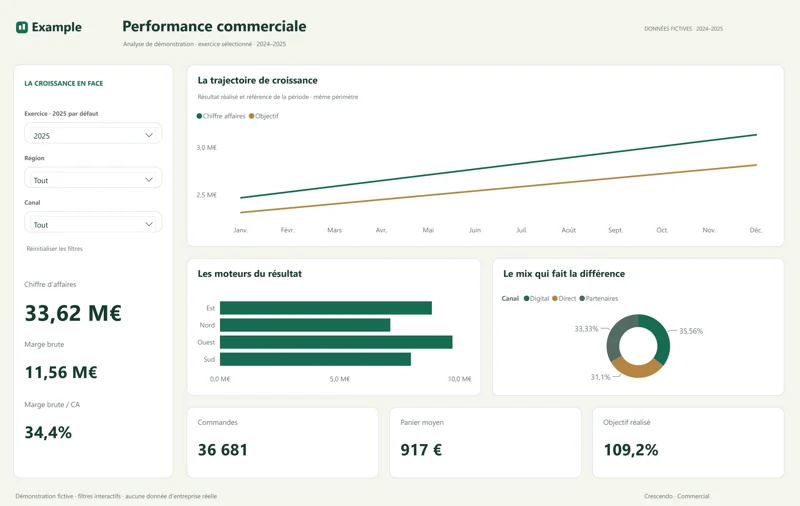
Crescendo
A results spine, a wide revenue trajectory and growth drivers.
Logistics
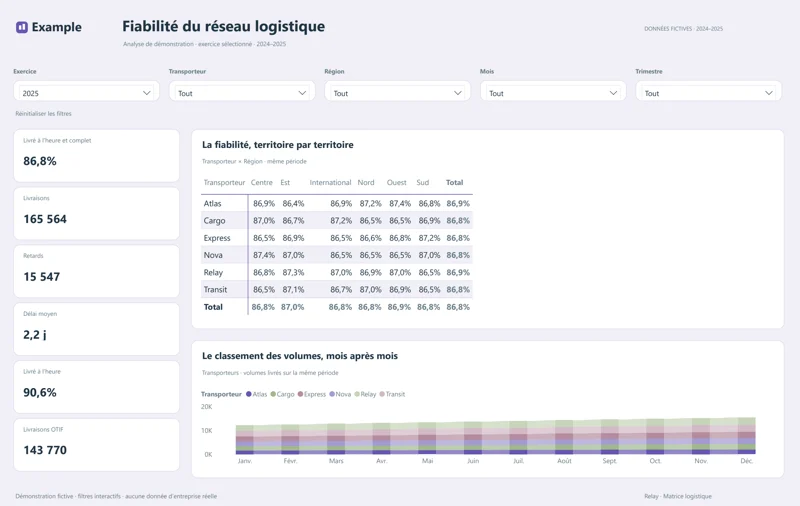
Relay
A carrier-by-region matrix, ranks over time and five filters.
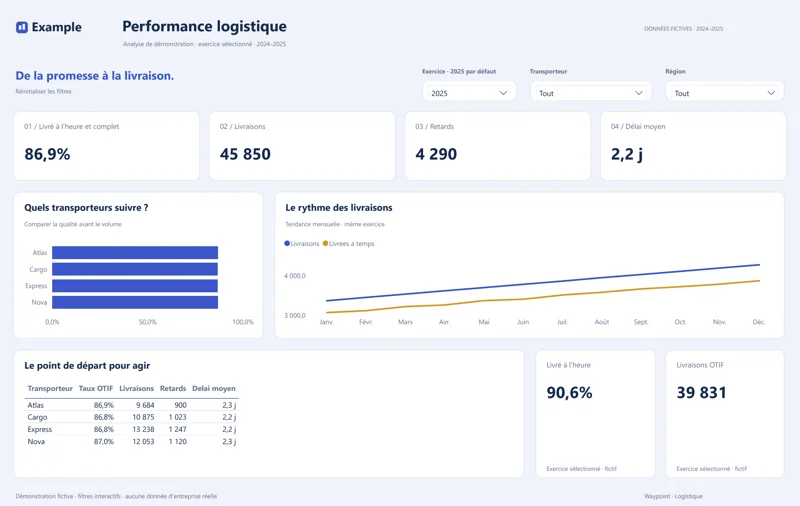
Waypoint
A dispatch board: reliability, volumes, carriers and exceptions.
Production
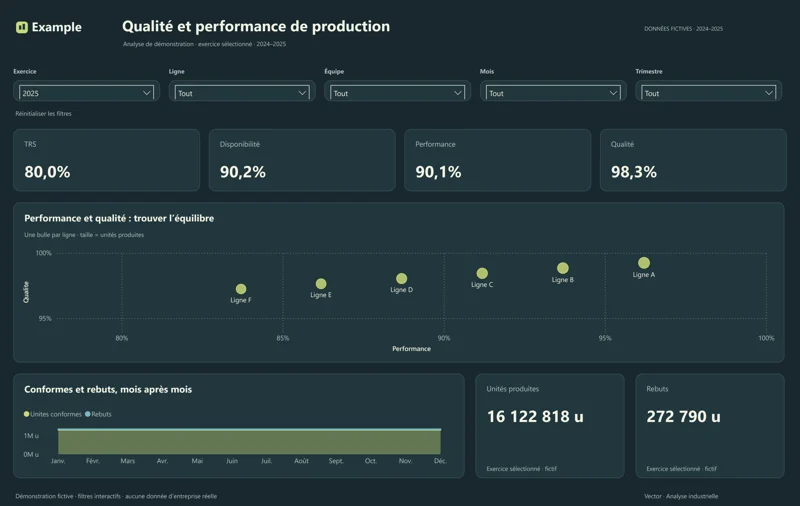
Vector
A performance–quality scatterplot, volume ribbons and production areas.
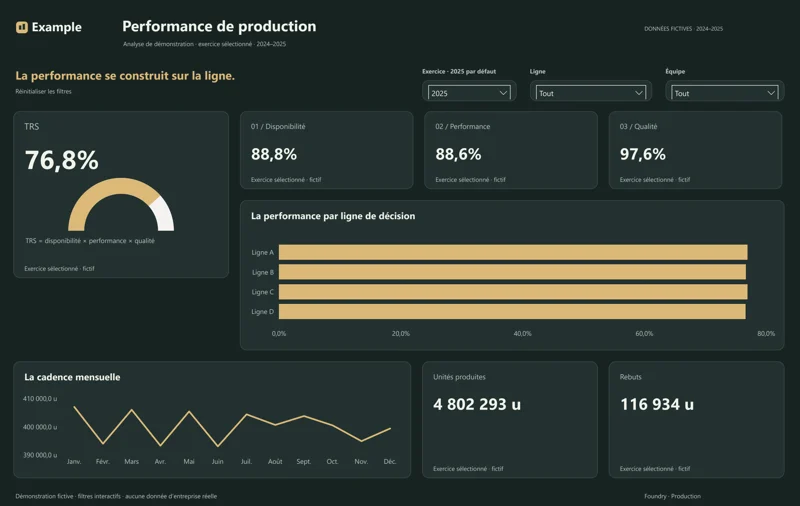
Foundry
An industrial control wall: OEE and its components, throughput and scrap.
Finance
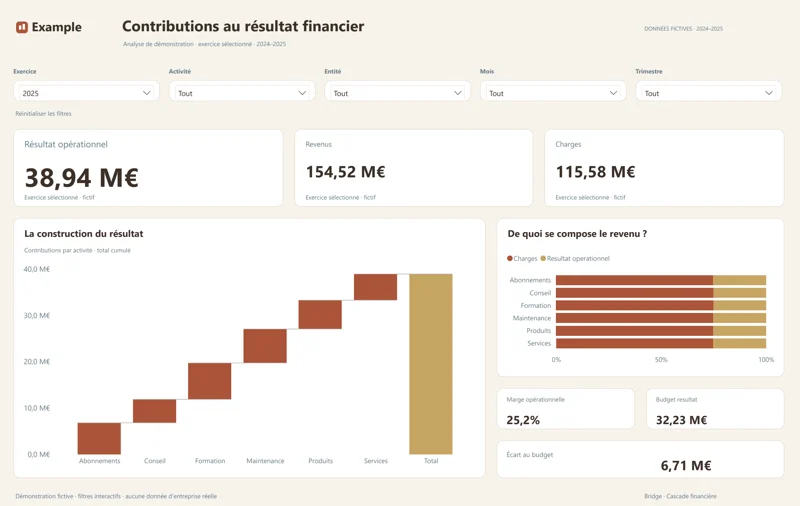
Bridge
An operating-profit contribution waterfall, revenue structure and five filters.
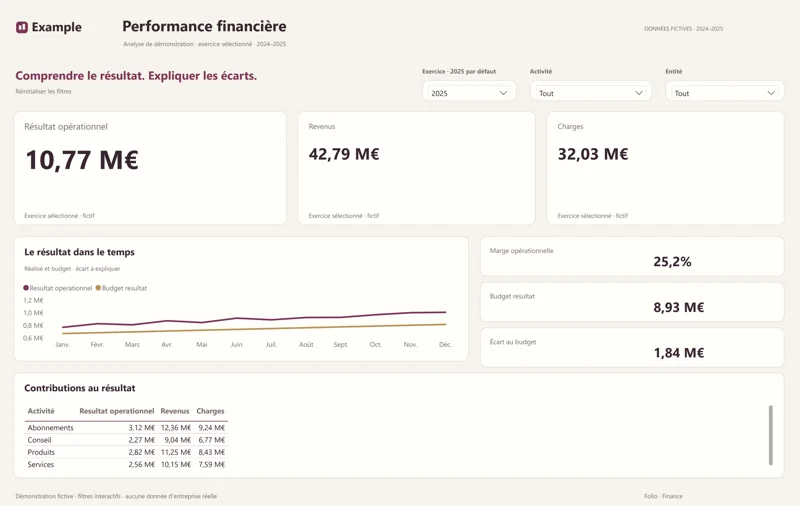
Folio
A financial editorial: operating profit, budget, costs and contributions.
People (HR)
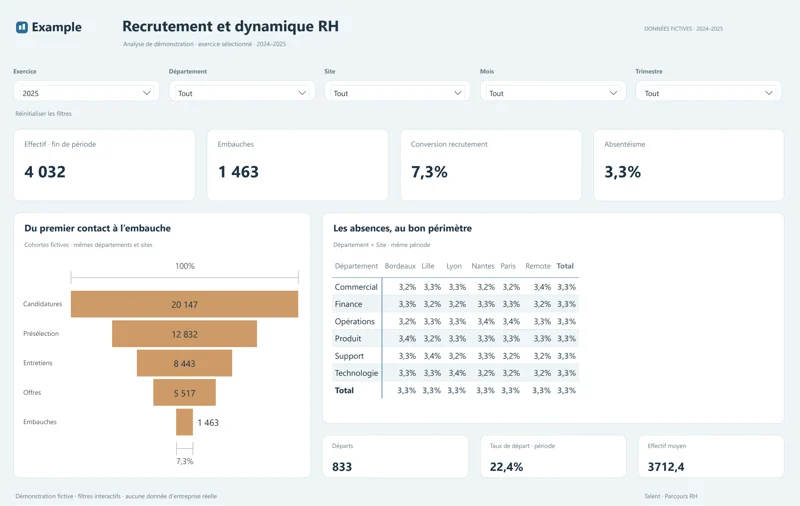
Talent
A recruitment funnel, departmental headcounts and an absence matrix.
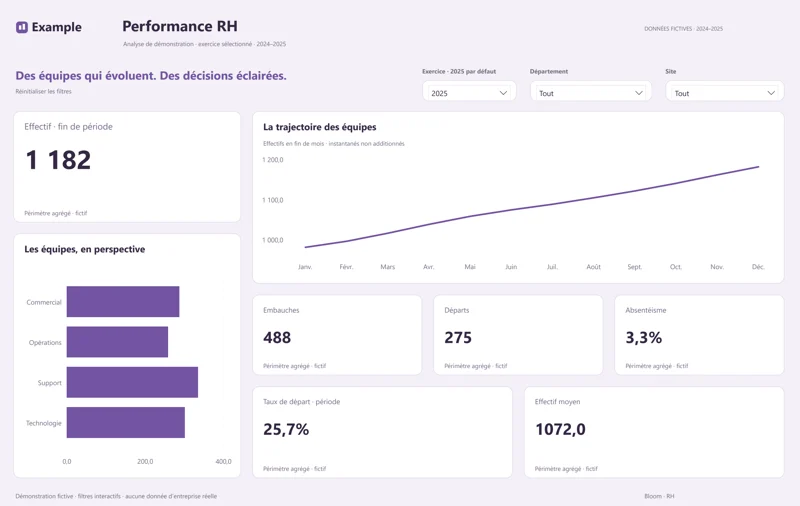
Bloom
A people story: headcount, hiring, departures and absenteeism.
Executive overview
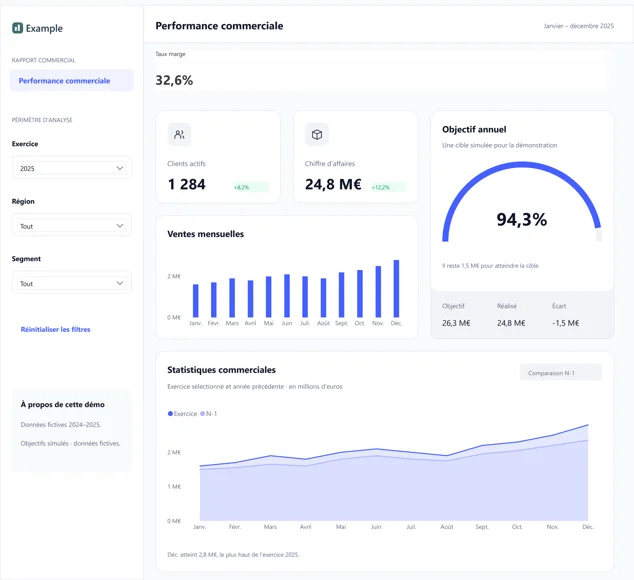
TailAdmin
A balanced overview: KPIs, annual target and trends.
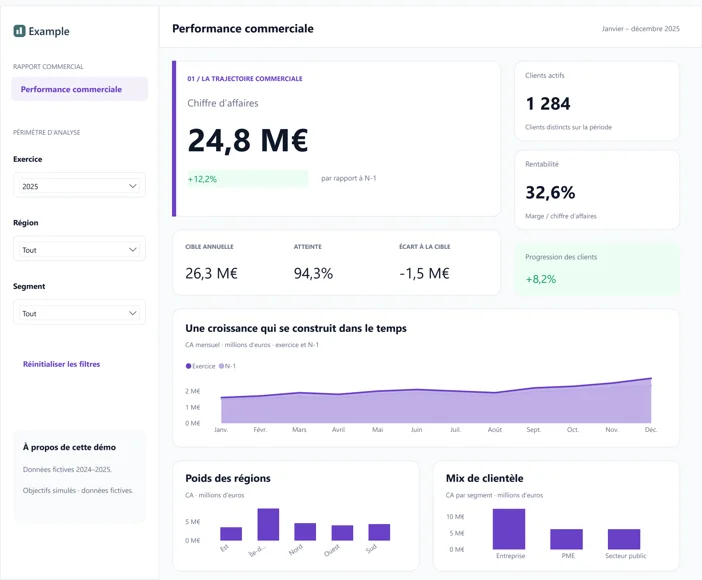
Prism
An editorial composition: a key metric, targets and contributions.
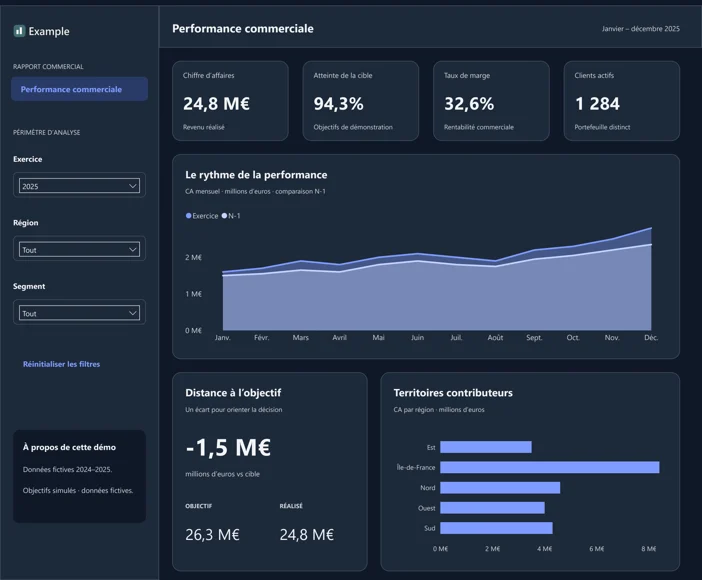
Orbit
A dark cockpit: metrics, trends and distance to target.
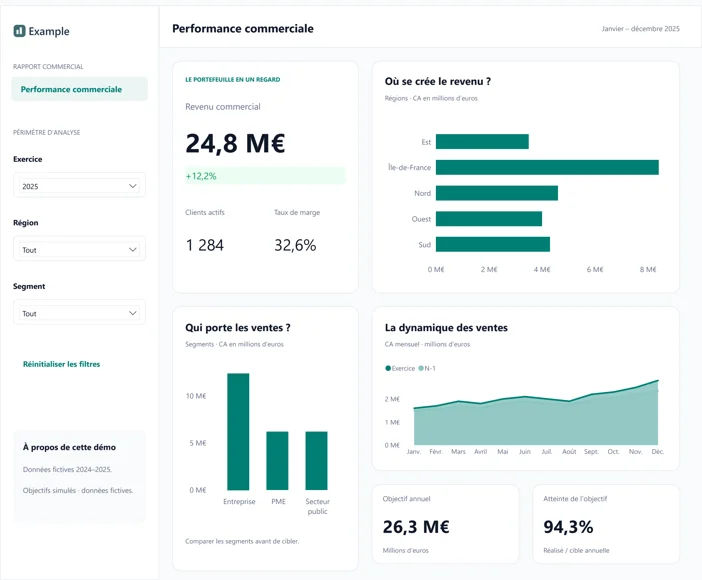
Mosaic
An asymmetric grid: overview, contributions and comparisons.
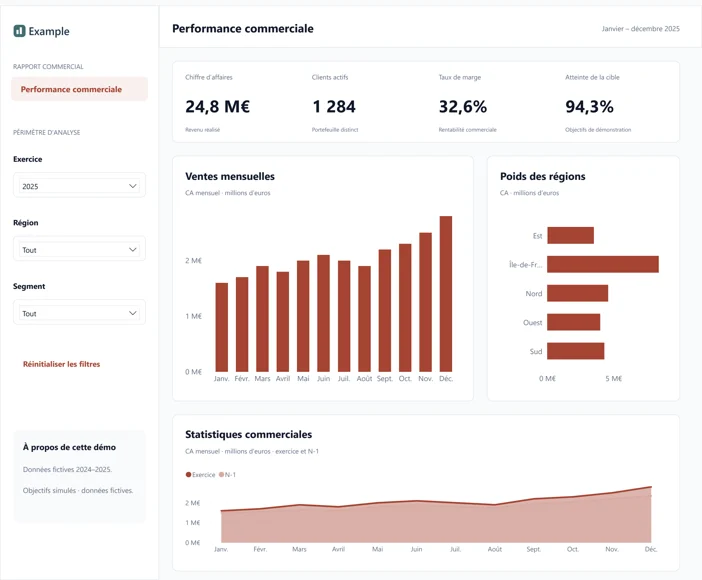
Ledger
A precise reporting grid: KPI strip, monthly volume and contributions.
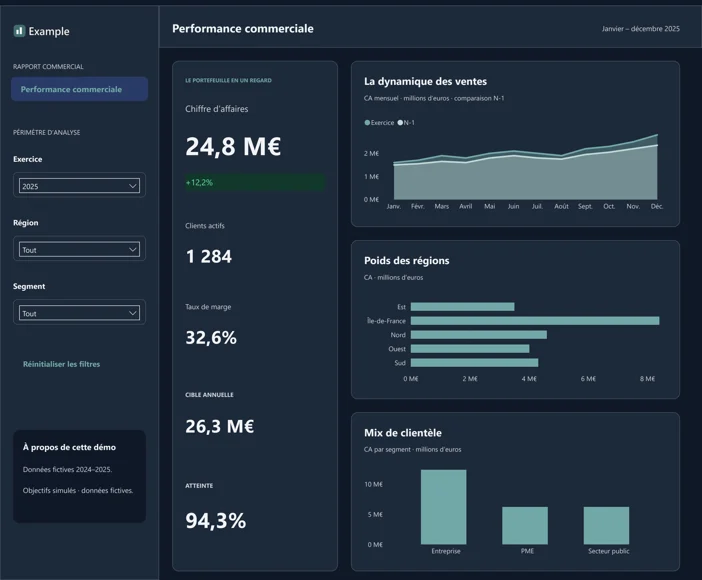
Contour
An insight column with analytical modules: trend, contributions and target.