Templates / Production
Vector: production report template for Power BI
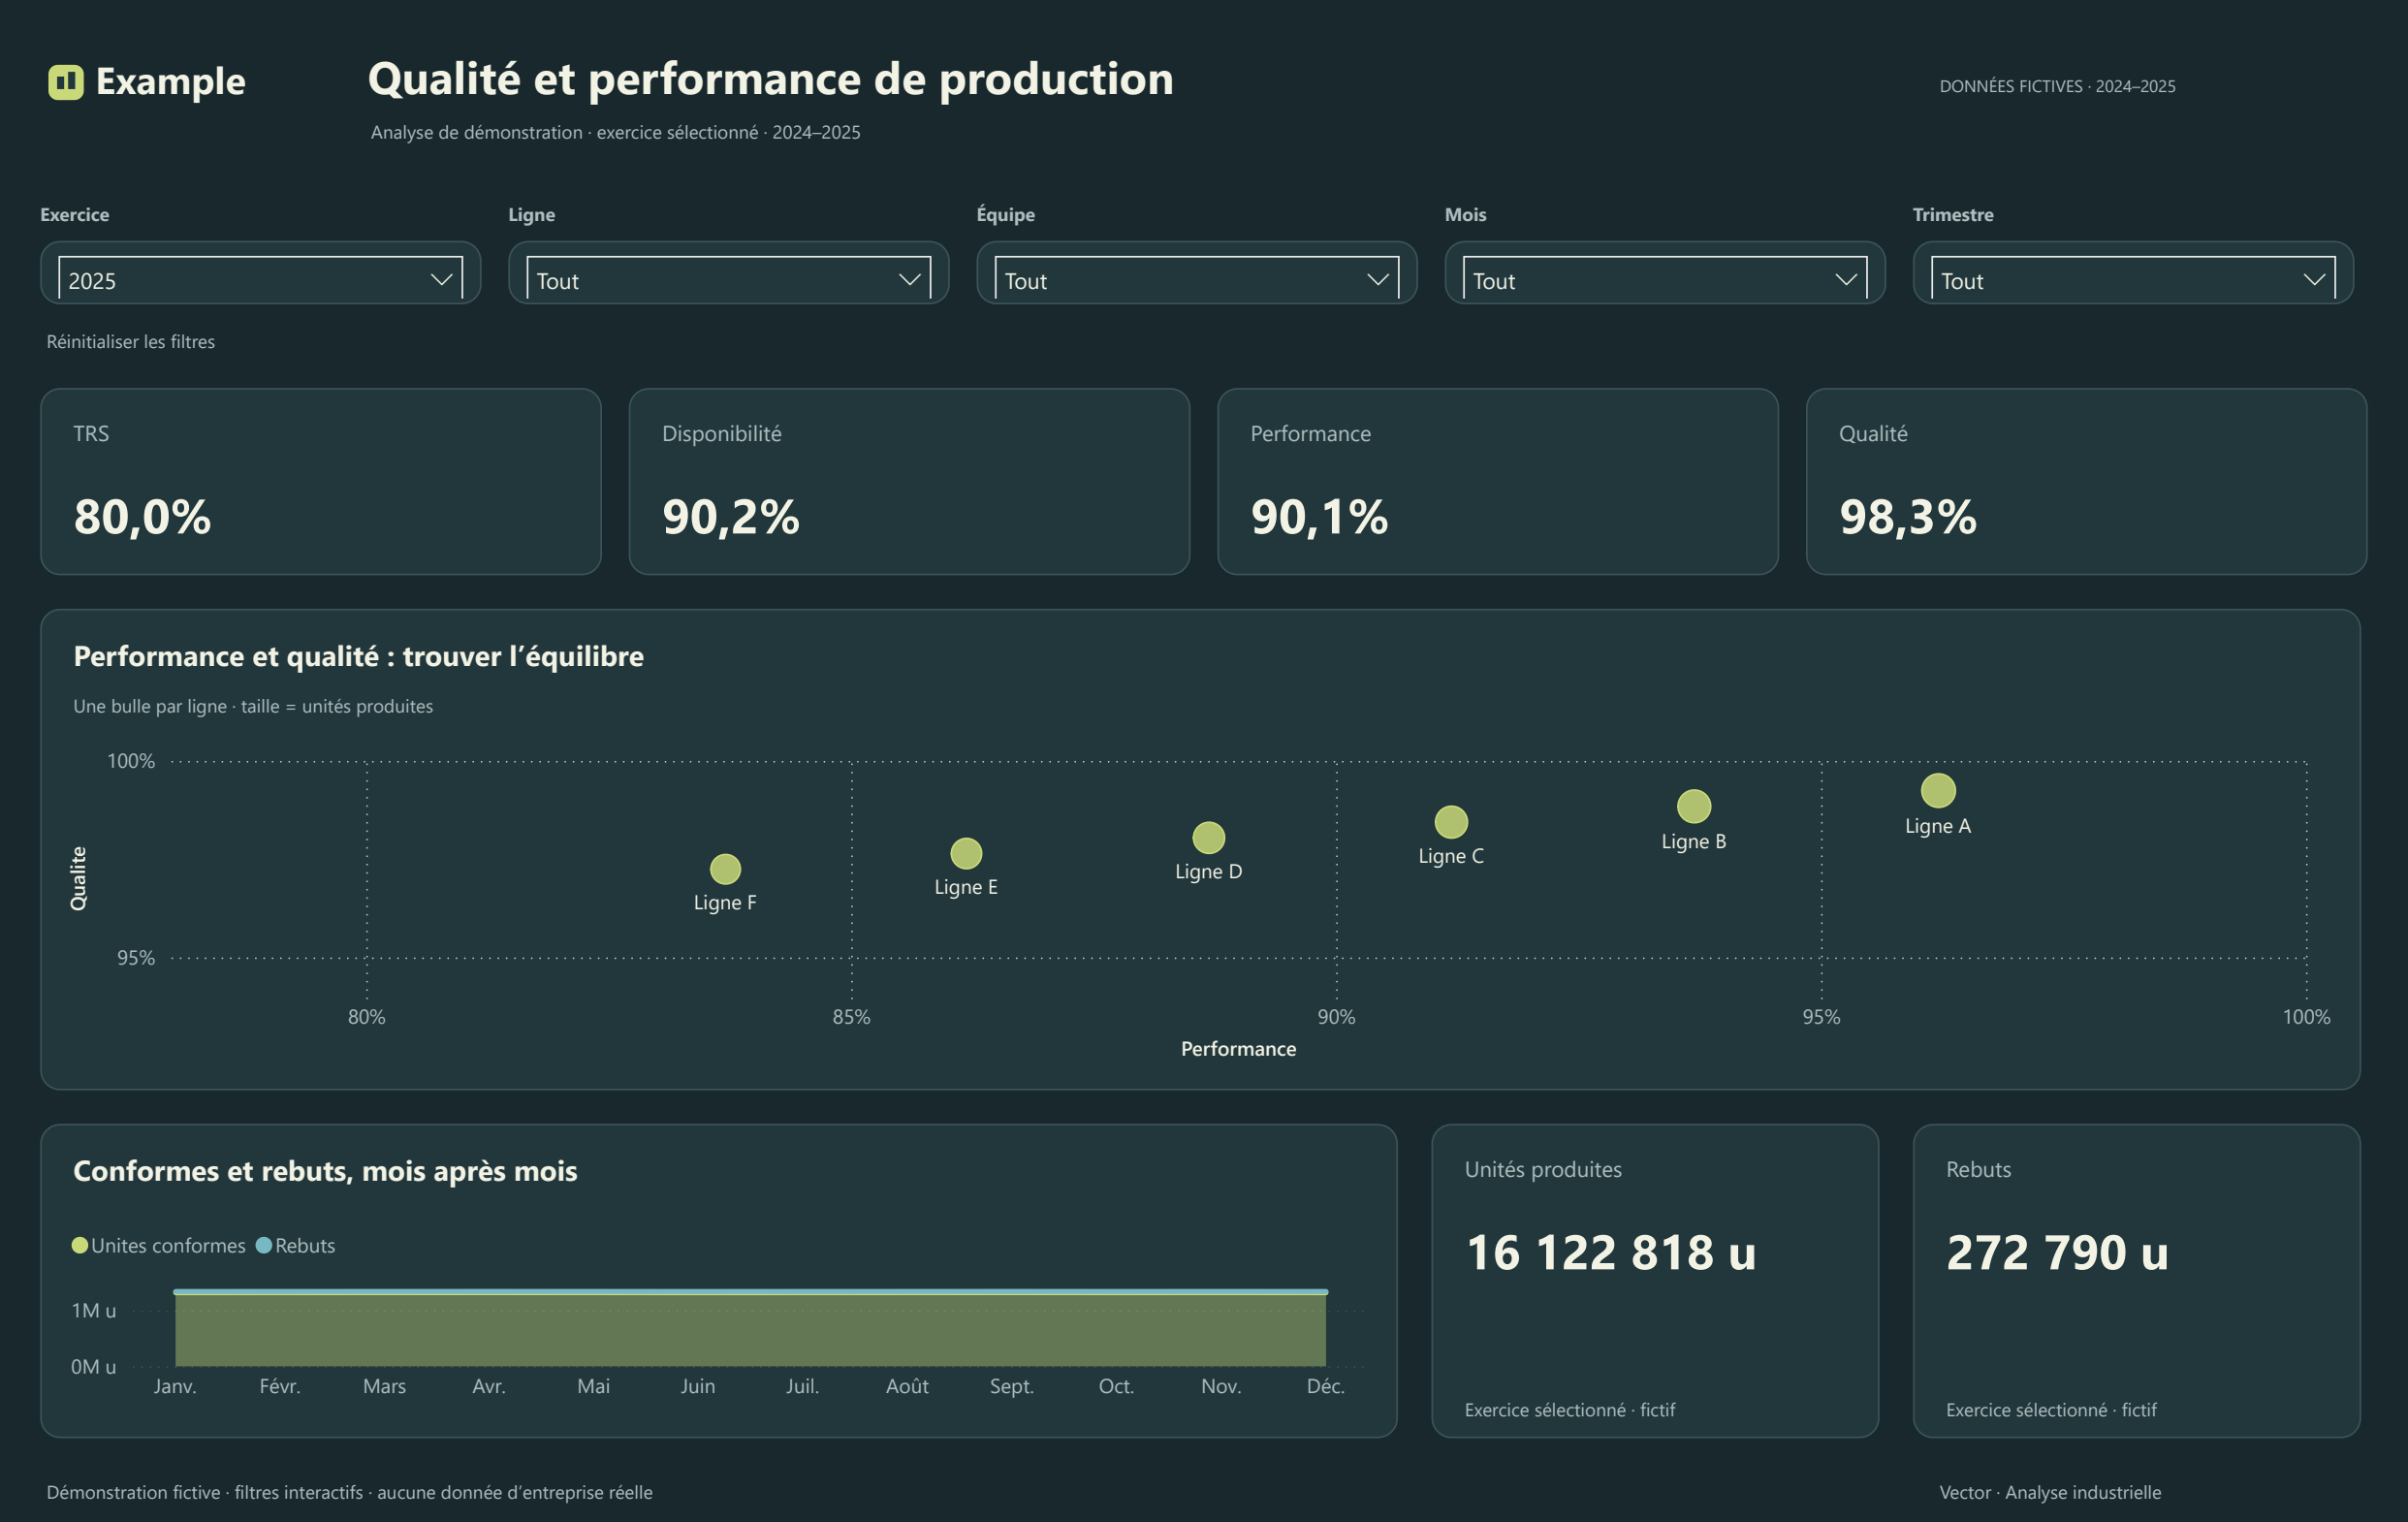
A performance–quality scatterplot, volume ribbons and production areas.
What it shows
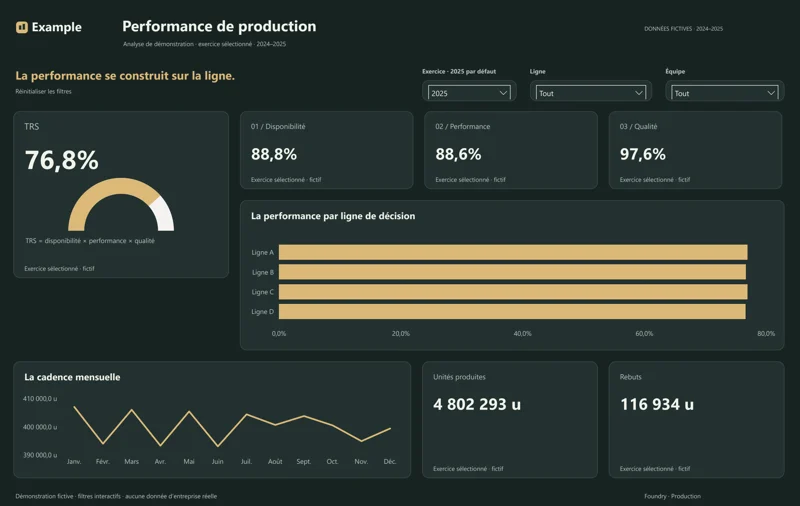
Monitor OEE and its components, throughput and scrap by line and shift.
Typical KPIs
- OEE
- Availability
- Performance
- Quality and scrap
What you get
- Native, editable Power BI visuals (PBIX)
- Dark theme, five top filters
- Fictitious demo data, PDF export
- Demo report labels currently in French
- Pages and KPIs adapted to your brief
How to start
Open the studio, describe the business need (goal, audience, pages, KPIs), choose Vector and generate a first demonstration report once signed in. Connect your own data model afterwards.